


Annual prices still falling in January
- … but monthly prices are now showing a small increase
- North East continues as the only region with price gains over the year
- Transactions remain at lowest levels of last seventeen years
Richard Sexton, Director at e.surv, comments:
‘House prices in England and Wales saw a slight increase this month, rising by £620 (0.2%) to reach a level last seen in February 2022. This marks only the second time in the past 15 months that prices have grown by more than 0.1%.

The three areas with an overall positive change in growth rates were the North East, Greater London and the South West. In December, for the fourth month in succession, the North East has the highest rate of price growth of all the ten GOR areas.
Our own experience is that market sentiment is improving. The combination of better news with regard to mortgage approvals in December and the holding of the bank base rate at 5.25% will encourage buyers.
We, of course, have a budget in less than a month’s time and all parties are looking at how they can better support the housing market. Housing remained fifth in the Ipsos Mori issues index, but its score edged upwards, suggesting that it is becoming more important to voters and this may be significant when it comes to the allocation of any public investment decisions.’
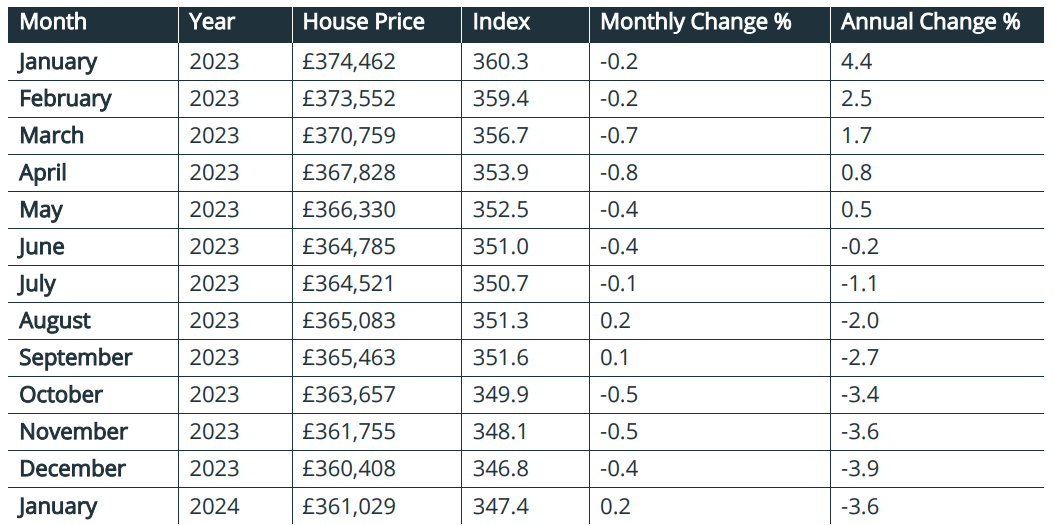
Table 1. Average House Prices in England and Wales for the period January 2023 – January 2024
Note: The e.surv Acadata House Price Index provides the “average of all prices paid for domestic properties”, including those purchases made with cash.
Commentary: John Tindale and Peter Williams, Acadata Senior Analysts
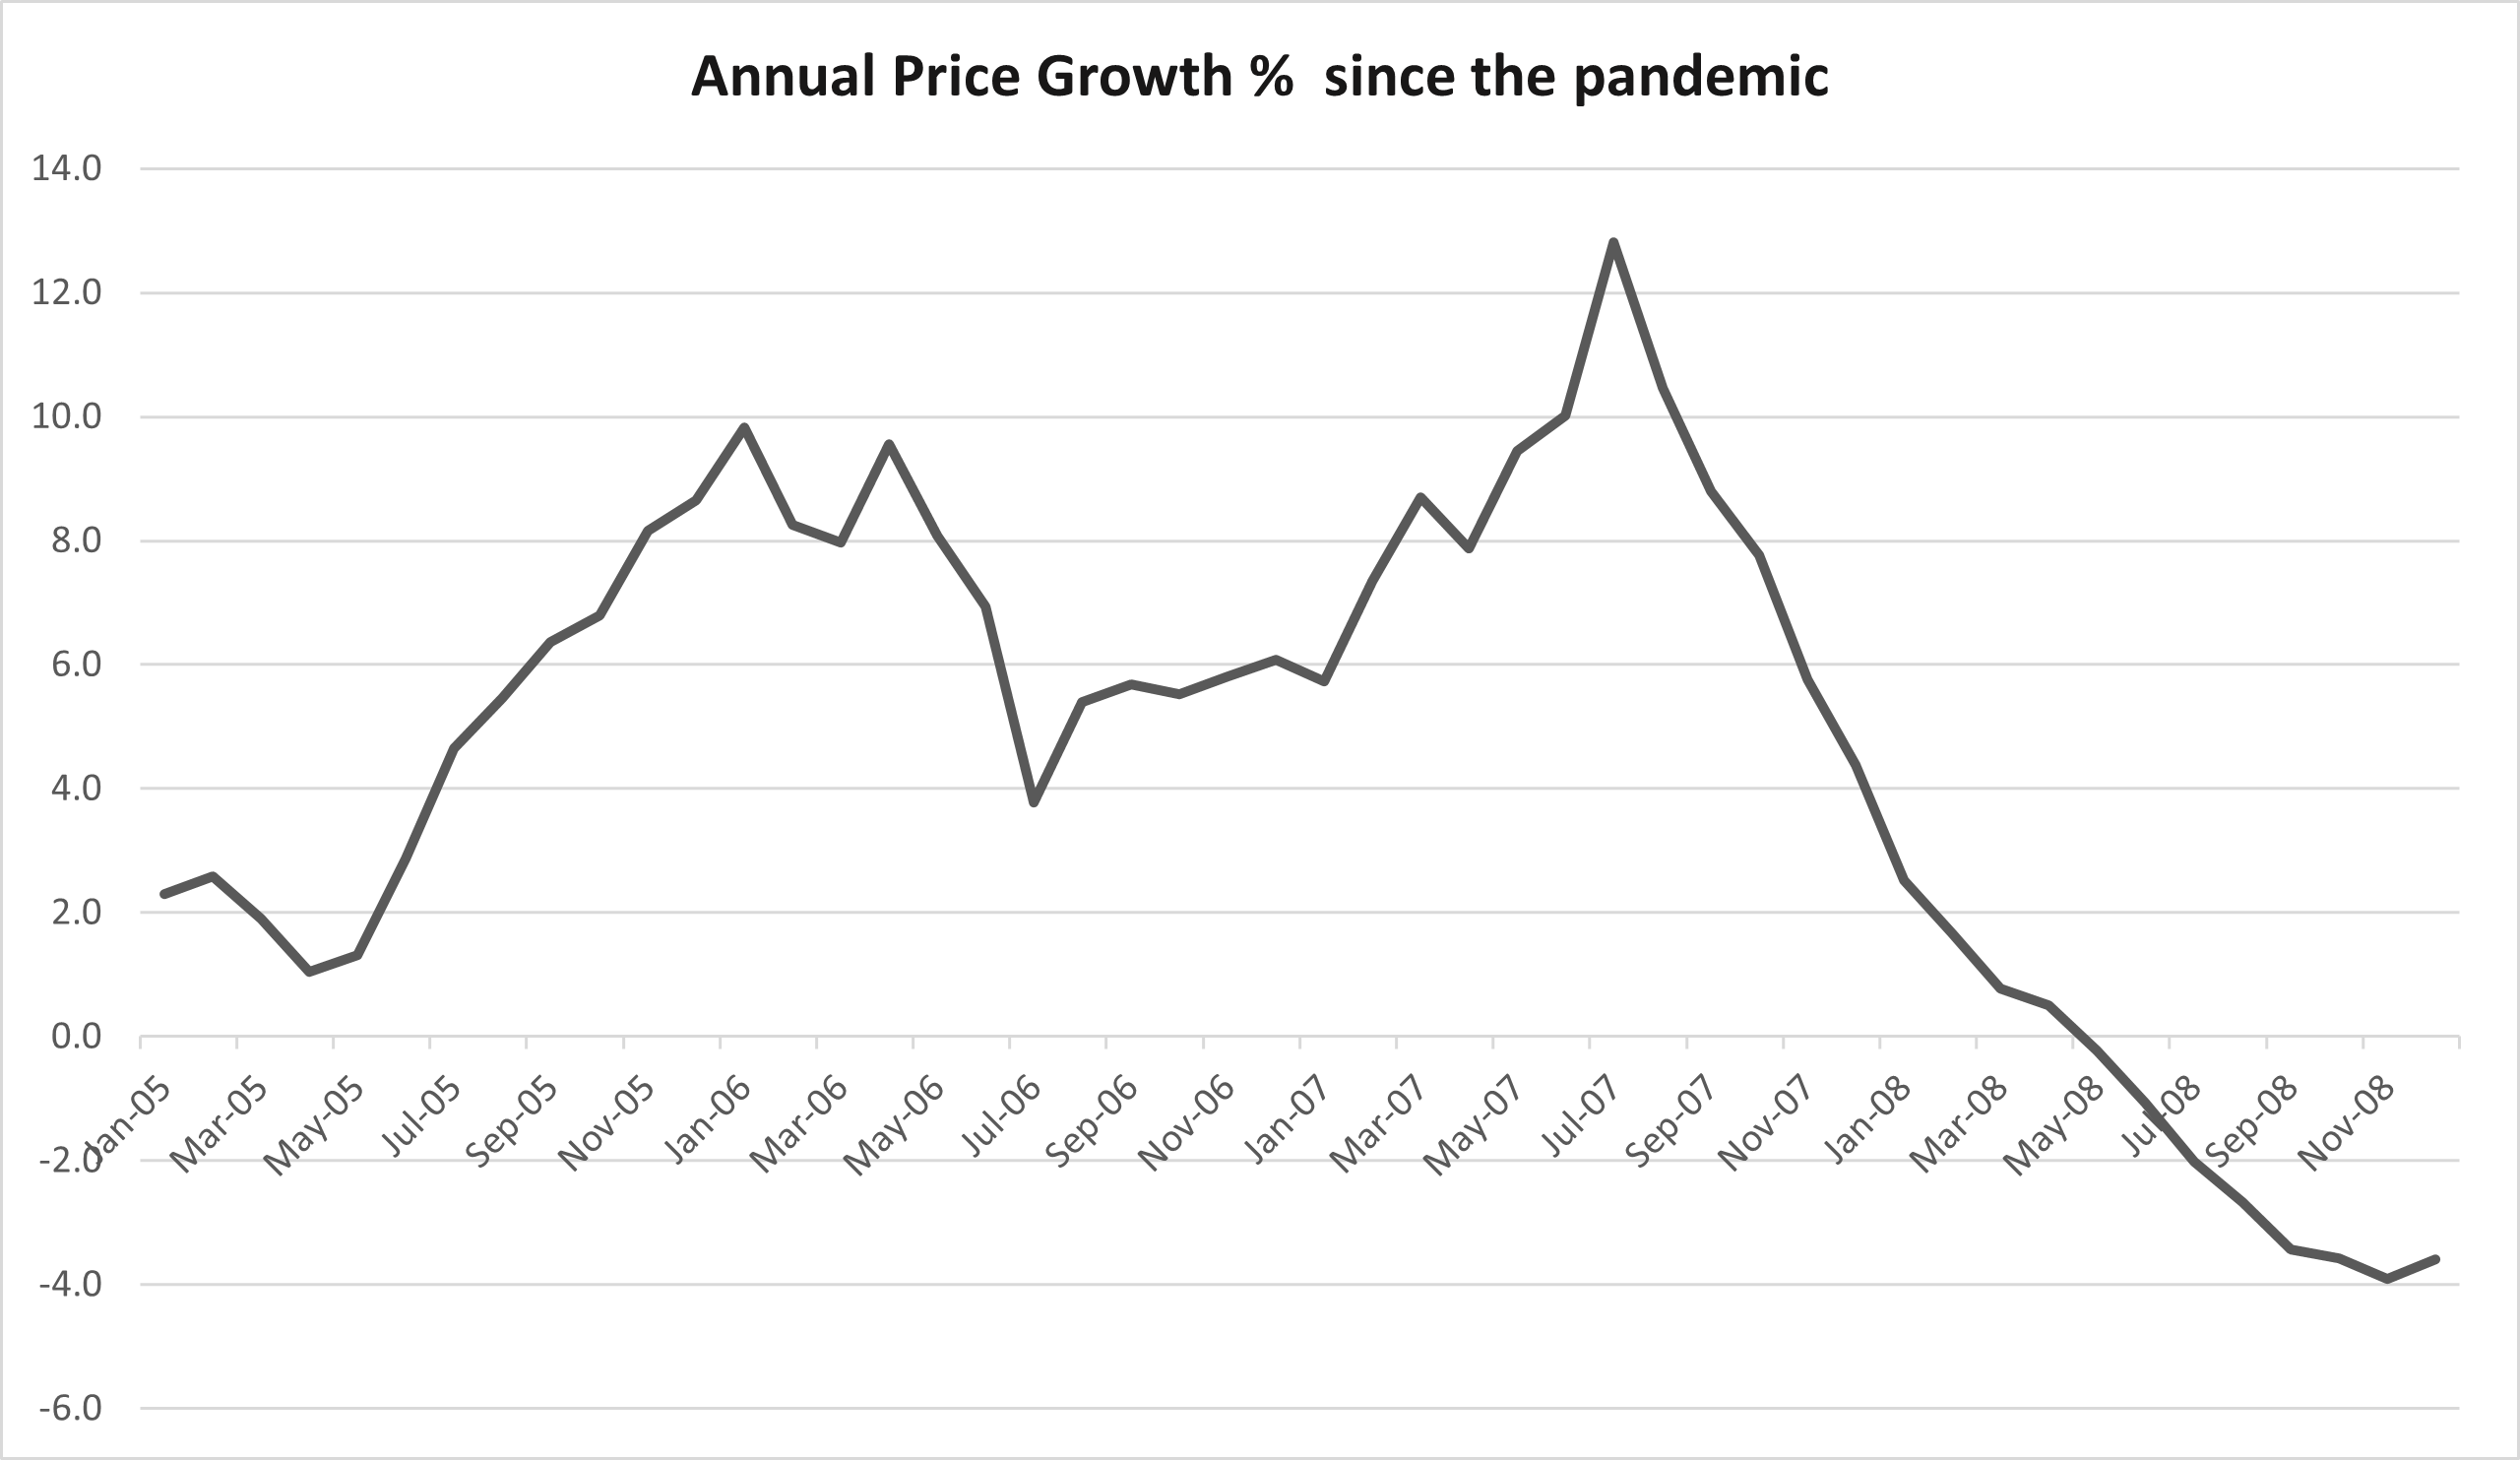
Figure 1. The annual rate of change in house prices in England and Wales, since the pandemic
The annual average sale price of completed home transactions using cash or mortgages in England and Wales in January 2024 fell by some £13,400, or -3.6%, and now stands at £361,029. This reduction follows a -3.9% fall in the annual rate seen in a revised December figure, so on that basis a slight uptick in rates has occurred.
On a monthly basis, house prices have also risen, in this instance by some £620, or 0.2%, in January 2024, and now stand at a level last seen in February 2022. This is only the second occasion in the last fifteen months in which prices have increased by more than +0.1%.
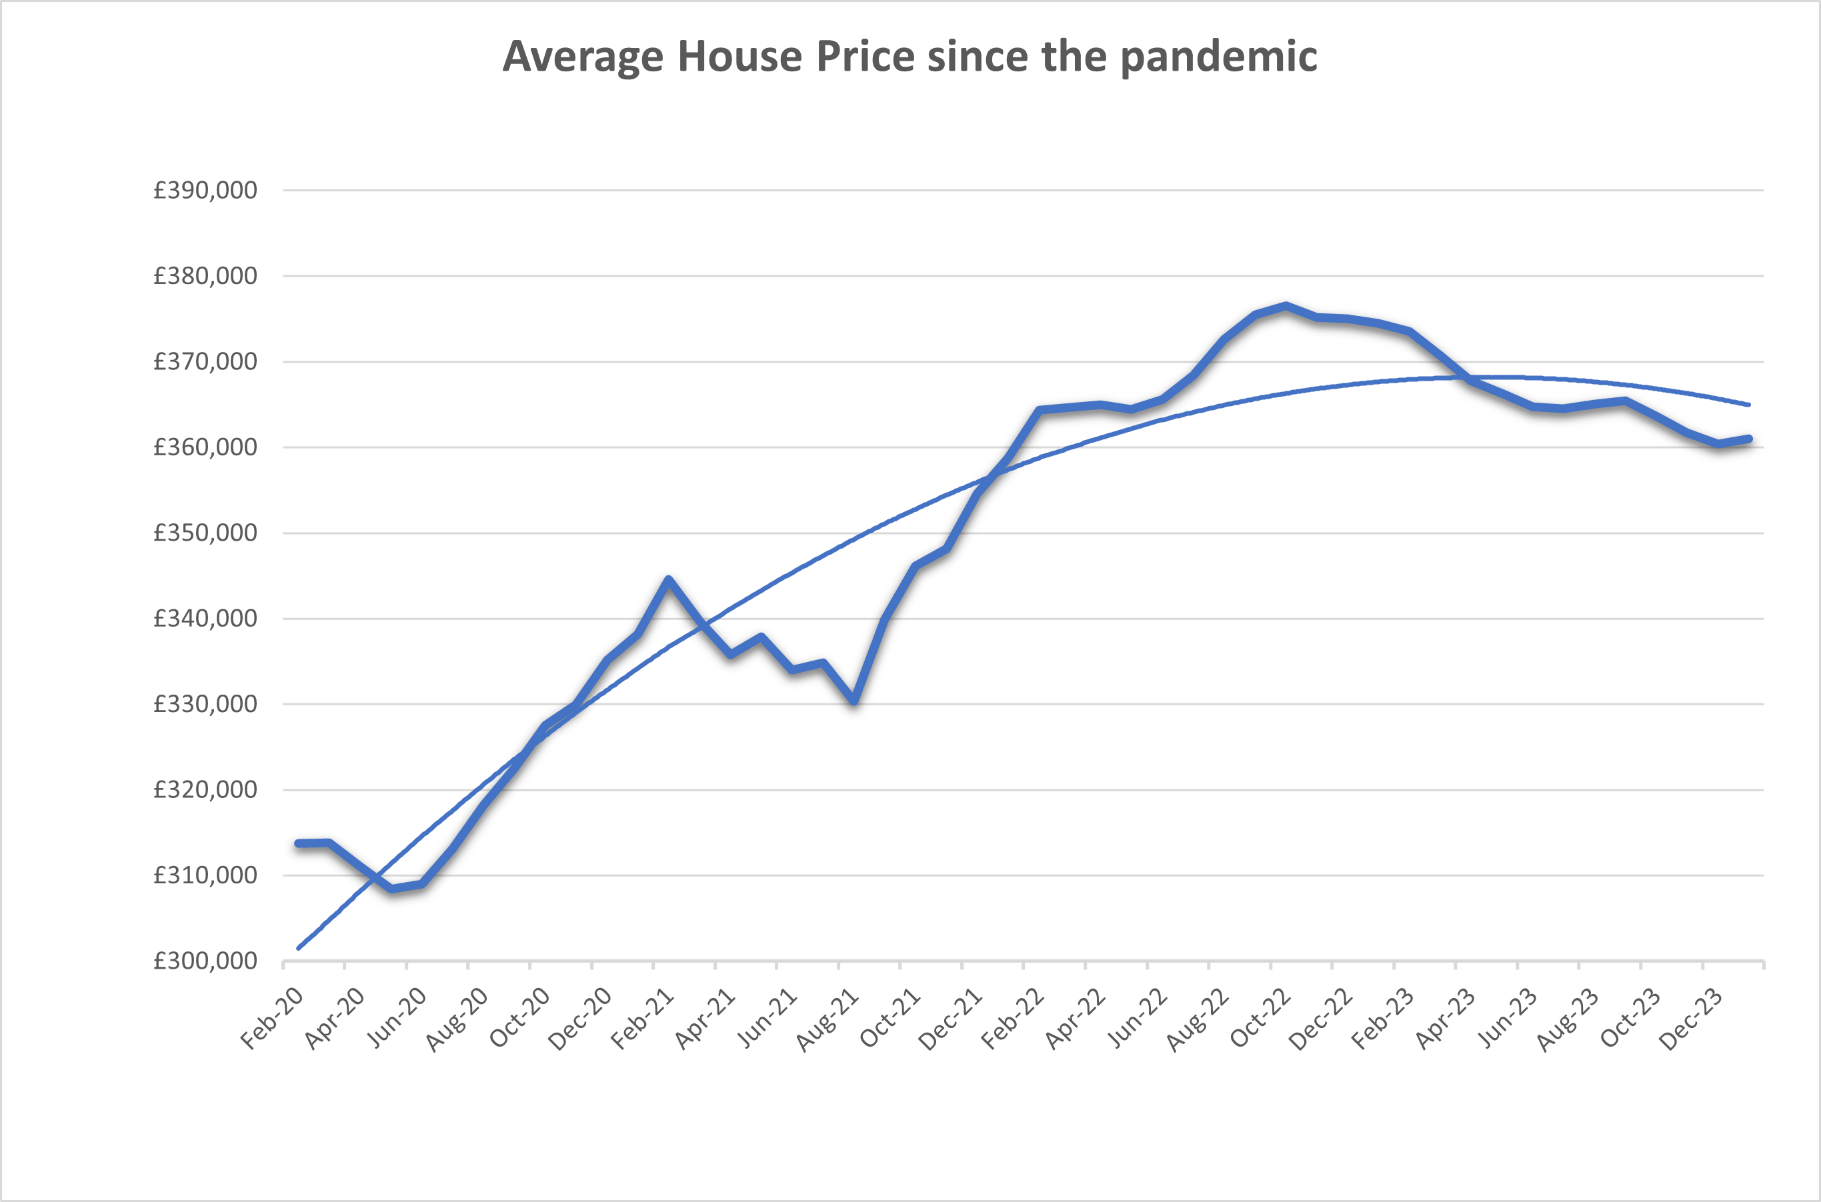
Figure 2. The average monthly house price growth in England and Wales, March 2020 – January 2024
However – as Figure 2 illustrates – in terms of actual (nominal) prices, the fall in price is a not insubstantial £15,500 since the peak in October 2022. While this must be viewed against the cumulative £47,200, or 15%, rise in average prices since the start of the pandemic in March 2020, it will still be significant for more recent buyers.
The housing market in January 2024 Sentiment surrounding the housing market has shifted over the last few weeks, highlighting once again the complex interplay of national and international factors involved. While the latter might become more negative as this year progresses and affect the market, the mood music in the UK has lightened somewhat, with commentators offering more positive commentary than might have been expected. The BoE recently reported that mortgage approvals in December were up marginally over November, with remortgages in particular showing a strong bounce. With inflation now falling (though still above target), the MPC held the bank rate at 5.25%. As shown later, the January Halifax house price index is back into positive territory at +2.5% on an annual basis, as well as both the Halifax and Nationwide monthly figures for January, up by +1.3% and +0.7% respectively. The GFK consumer confidence index has continued to rise, although it is still in negative territory in January. It is, however, moving in the right direction.
Taken together, positivity has crept back into the market, and it seems reasonable to assume that this will be reflected in other data as they are published – and indeed as shown here with the e.surv Acadata index. Looking ahead, the UK government is still exploring ways to boost the first-time buyer market – discussion now seemingly focusing on 99% mortgages. Further details are awaited. Housing remained fifth in the Ipsos Mori issues index, but its score edged upwards, suggesting that it is becoming more important in the run up to the election. And this may be significant when it comes to the allocation of any public resources in the new government.
Average Annual English Regions and Wales House Prices
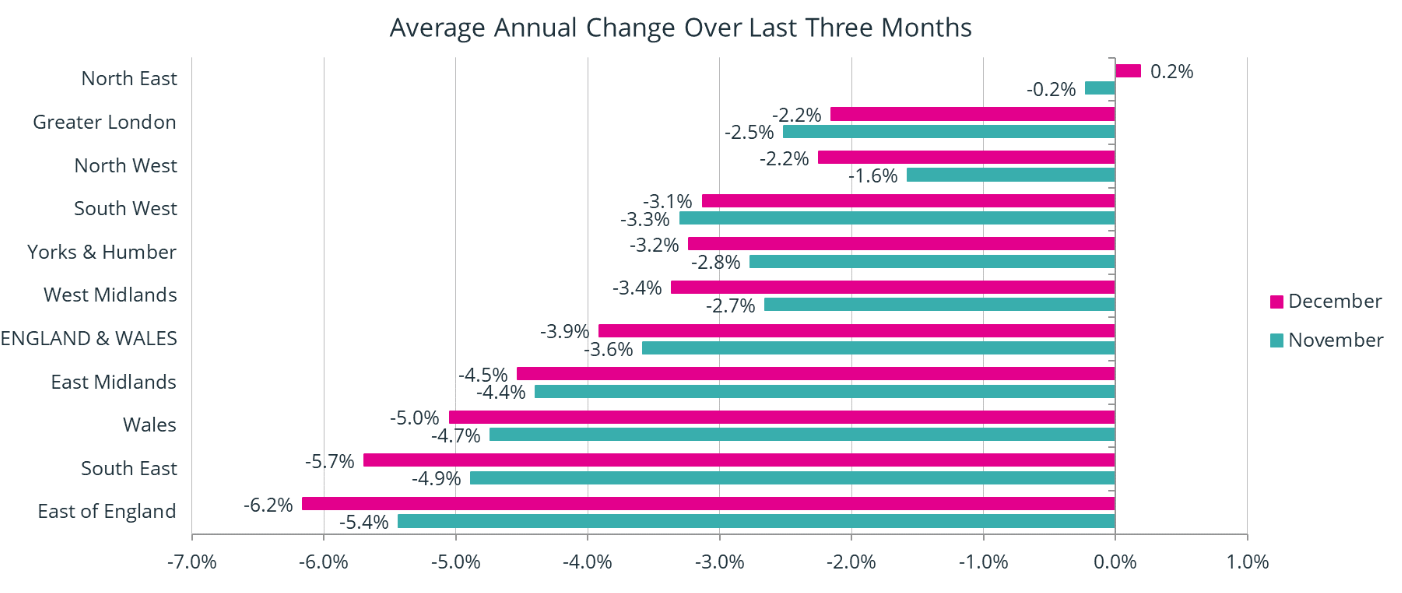
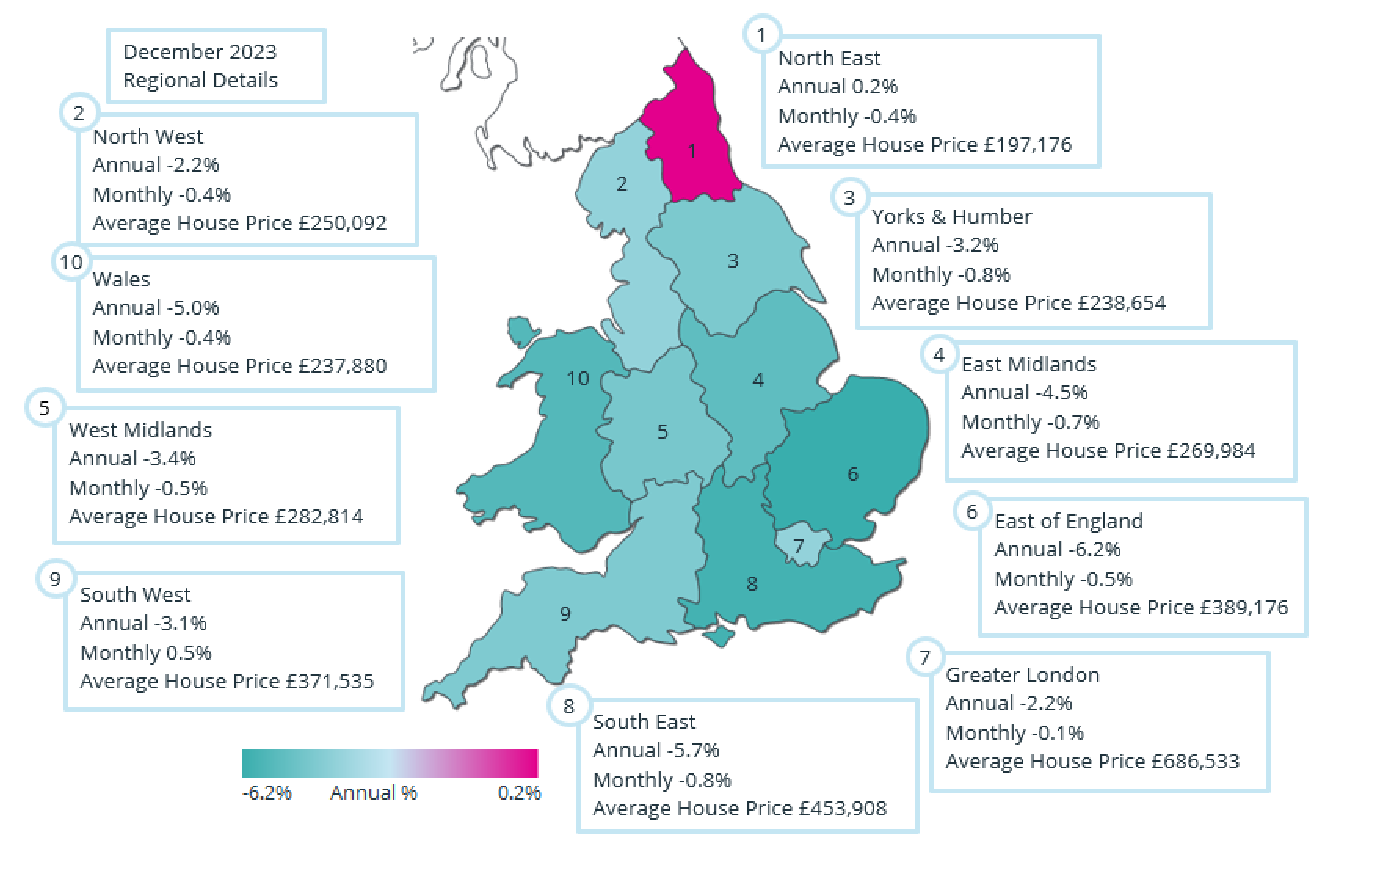
Figure 3. The annual change in the average house price for the three months from November 2023 to January 2024, analysed by GOR
Figure 3 shows the percentage change in annual house prices on a regional basis in England and for Wales, averaged over the three-month period of November 2023 to January 2024, compared to the same three months in 2022/23. These figures are calculated on a rolling three-month basis to smooth out the minor changes in price which almost inevitably arise, and are centred on December 2023 (pink line), with Figure 3 also showing the similarly averaged figures for November 2023, one month earlier
(blue line). The e.surv Acadata prices are also adjusted for seasonal variation.
The chart highlights the varied price movements among the 10 GOR areas, with three showing an upward movement in their rates compared to the previous month, and seven where price declines accelerated. The largest upward change in rates took place in the North East, up by +0.4% on the previous month, making it the only region to have a positive annual rate of growth, at +0.2%. The largest downward movement in rates occurred in the South East, where prices fell by an additional -0.8%, resulting in a decline of -5.7% on an annual basis.
The three GOR areas with an overall positive change in growth rates were the North East, Greater London and the South West. The seven areas where prices deteriorated further were, in ranked order (smallest to largest), the East Midlands, Wales, Yorkshire and the Humber, the North West, the West Midlands, the East of England and the South East.
In December, for the fourth month in succession, the North East has the highest rate of price growth of all the ten GOR areas. In fact, the area has been in one of the top five spots for regional price growth for ten of the last twelve months. It is likely that it has held this position as a result of having the lowest average house price of all the ten GOR areas in England and Wales, at £197,176, compared to second placed Wales, where the average price is £237,880. In the current housing market, affordability is a key factor, and lower priced areas have attracted more purchasers.
In the North East, only two of the eight constituent authorities in the region have price increases, being Northumberland at +4.9% and Tyne and Wear at +1.4%, although these two areas combined account for 53% of the regions house sales. In Northumberland, all property types, except detached homes, have seen price increases over the year, with the largest increase being in terraced properties, while in Tyne and Wear it is only flats that have had an upward movement in prices over the period.
Coming second this month is Greater London, with a fall of -2.2% in values over the last twelve months. Greater London was bottom in Table 3 for the first five months of the last twelve, but has now been in one of the top three places over the last three months. In Greater London, only 8 of the 33 London boroughs have recorded a positive movement in prices over the past year, but 7 of these boroughs are in London’s top 10 when ranked by average value. The City of London leads the pack in
terms of price growth, at 36.9%, although the volume of sales in the City of London is traditionally very low at an average 12 property sales per month, which tends to lead to volatile average prices.
However, both Kensington and Chelsea and the City of Westminster, in second and third position in London’s growth league, have seen values rise over the year by 6.9% and 4.2% respectively, suggesting that it is the prime London markets that are seeing the largest gains in price. A number of observers suggest that central London has regained its popularity, especially for flats, as more commuters return to work from the office.
Perhaps as the corollary to this change in behaviour, the East of England and the South East have both been at the bottom and next-to-bottom of the Table 3 growth league for the last seven months, with annual price changes of -6.2% and -5.7% respectively. The suggestion here is that properties that require a long commute into a city centre have become less popular, despite their attractive rural locations.
In the East of England, only 1 of its 11 constituent areas has seen price growth over the year, being Bedford, at +0.1%. The three constituent areas in the East of England with the largest fall in prices over the year are Central Bedfordshire, -11.0%, Essex -8.4% and Luton -7.7%. A similar story prevails in the South East region, with all 19 of its constituent areas experiencing price falls over the year. The greatest falls are in Portsmouth, -11.1%, Brighton and Hove, -9.2%, and Bracknell Forest -8.6%.
On a monthly – as opposed to annual – basis, looking at the price movements in the 10 GOR areas in December, there was only one area with a price increase, being the South West, at +0.5%, with the nine remaining GOR areas all having price falls. The two largest fallers in the month were the South East and Yorkshire and the Humber, both down by -0.8%. In the South West, the three constituent areas with the highest price gains in the month were Bournemouth, +2.7%, Gloucestershire +1.5% and Wiltshire +1.3%.
England and Wales Regional Heat Map
The shading shown for this December 2023 Regional Heat Map remains remarkably similar to that for November 2023, suggesting that the regional markets have not seen too many changes over the Christmas period.
The first group relates to the red area in which there is still just one member, the North East, being the only GOR area in December to have a positive annual rate of growth in prices, at +0.2%.
The lighter greens of the North West and Greater London follow, where the annual price falls are no lower than -2.2%.
Then come the mid-green areas of the South West, Yorkshire and the Humber and the West Midlands, where the annual price falls are no lower than -3.4%.
These three areas are then followed by the East Midlands and Wales, where price growth ranges between -4.5% and -5.0%.
Finally, there are the two remaining regions of the South East and the East of England, where prices have been falling by -5.7% and -6.2% respectively, with significantly both regions being based in the south east corner of England.
Annual Change in prices
The annual price change in England and Wales in January 2024, taking both mortgage and cash-based house purchases into account, was an arithmetic average of -3.6%. The rate of -3.6% in January is +0.3% higher than the revised rate of -3.9% for December 2023, and again represents an upward movement in the annual rate of house prices, even while the annual rate itself remains negative. The direction is all important here.
The average house price now stands at £361,029, some £13,400 lower than a year earlier, and is close to the price seen in February 2022, some twenty-three months ago.
In December 2023, only 11 of the 111 Unitary Authority areas in England and Wales were recording house price gains over the previous twelve months, which is 8 fewer authorities with price rises over the year than in November 2023.
The area with the highest annual increase in prices in December 2023 is Gwynedd in Wales, up by 6.4%. In Gwynedd, prices for both detached and semi-detached homes have increased over the last twelve months, with the most significant increase on a weight-adjusted basis being detached properties, up from an average £345k in December 2022 to £370k one year later. The average price of detached homes in Gwynedd was assisted in the month by the purchase of a 4-bedroom detached
home in Abersoch, overlooking the Golf Course, the local beach and Cardigan Bay, for £1.15 million.
By way of contrast, the area with the largest fall in prices over the last twelve months was – perhaps ironically given its proximity to Gwynedd – Denbighshire. In Denbighshire, prices have fallen by 16.1% over the year, with the largest fall in average values being detached properties, down from an average £310k in December 2022 to £245k in December 2023. However, it is perhaps likely that this had more to do with the attributes of the individual houses sold in the period, as opposed to a collapse in the
housing market. Further research reveals that there were 16 detached properties sold in Denbighshire between October 2022 and December 2022 having values in excess of £500k, while in the same three months in 2023 the highest priced detached home was sold for £485k.
Monthly Change in prices
Average house prices rose by some £620, or +0.2%, in January 2024. This was the largest increase in prices in a month since October 2022.
In December 2023, prices rose, on a monthly basis, in 33 of the 111 Unitary Authority areas, which is 14 fewer than in November. The area with the biggest increase in prices in December was Reading, up by 2.9%. In Reading, flats saw the largest increase in prices, up from an average £231k in November 2023 to £235k one month later. The desire for an easy commute into London may have been a factor in this increase in flat prices, as Reading has a fast train service into Paddington, and is also on the now established Elizabeth tube line.
At the other end of the scale, the authority with the largest fall in prices in December was Darlington, where prices fell by -5.3%. All property types in Darlington saw a reduction in their average values during December. This was particularly the case for detached properties, with the third-highest priced detached home – with 5 bedrooms and which sold for £840,000 – dropping out of the statistics in December 2023, with no similarly priced replacement taking its place.
Comparison of Indices
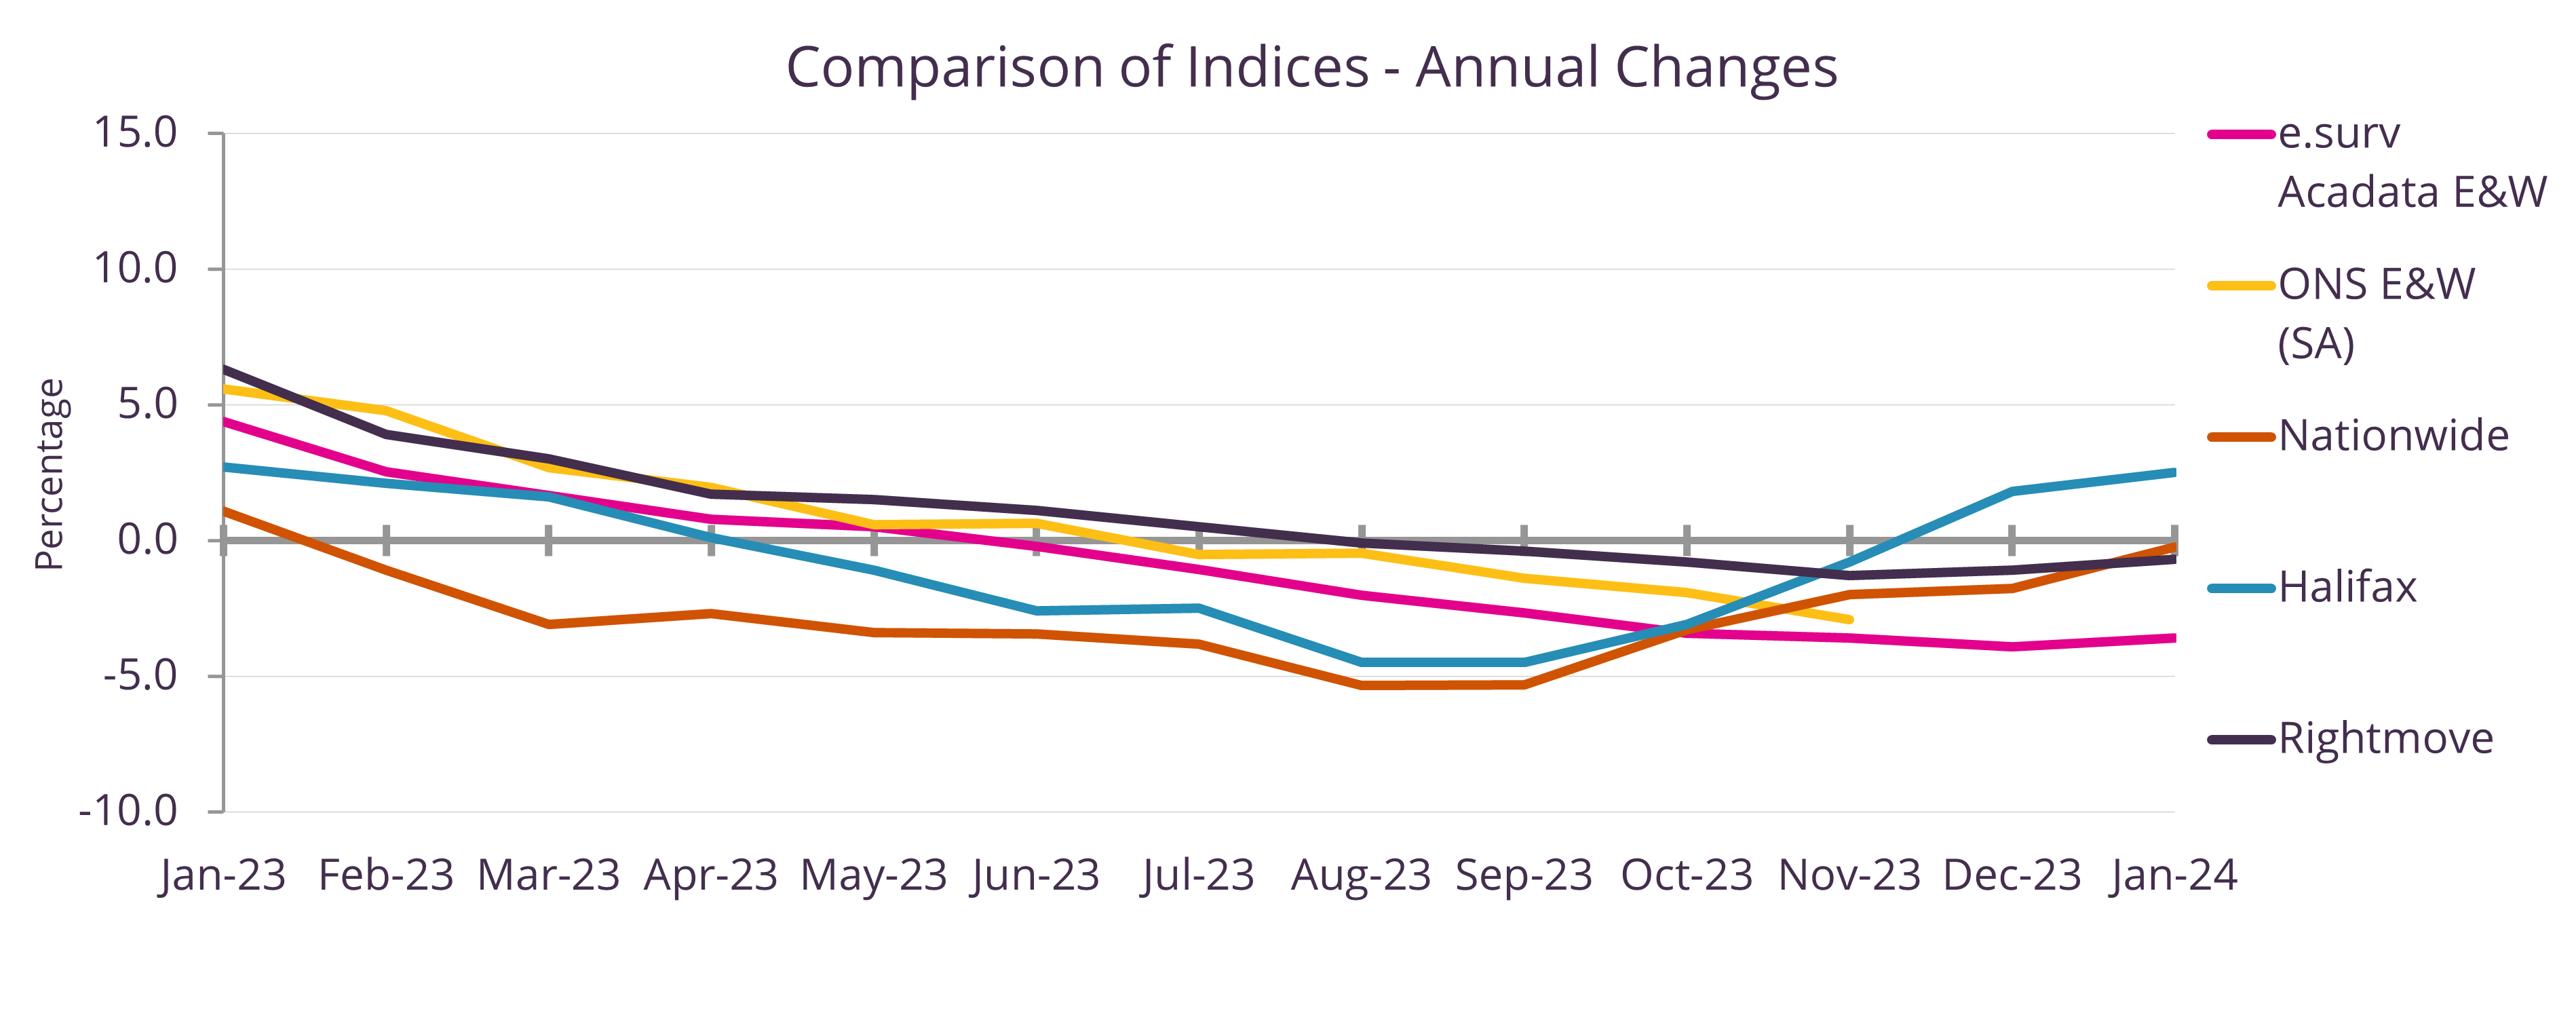
Figure 4. The annual change in house prices January 2023 – January 2024
This month, Figure 4 compares the annual rate of change in home prices as measured by the five different index providers (as listed to the right of the graph), for the period January 2023 to January 2024. The annual index chart is considerably less volatile than the monthly chart which was featured last month. All five indices show the same direction of travel, although the two lender indices of the Halifax and Nationwide are both showing an uptick in the rate of growth in prices from October 2023, which has not yet been so prominent a feature in the other three indices.
Looking at the range between the highest and lowest annual rates for the thirteen months displayed, the widest range occurred in March 2023, at 6.1%, with Nationwide having the lowest reading of -3.1%, while Rightmove reported +3.0%. The smallest range occurred in October 2023 at 2.6%, with e.surv Acadata reporting -3.4%, Nationwide reporting -3.3% and Halifax -3.1%, while Rightmove reported -0.8%. For the record, the average range during 2023 was 4.6%, which happened to occur in both April and June 2023.
So why the differences between the indices? As previously reported, the two most significant factors affecting the indices are timing and methodology. Basically, Rightmove is reporting on market sentiment, being based on the price that a seller advertises a property at on Rightmove’s web site, while the two lender indices are based on the property price against which the lender will offer a loan, i.e., well before completion; and finally e.surv Acadata and the ONS HPI both use Land Registry Price Paid data, this being the actual value paid for a property on the date of sale.
Last month, it was suggested that if a three-month time delay between the two lender and the two Land Registry based indices is introduced, the time lag disappears. The next graph shows this to be the case:
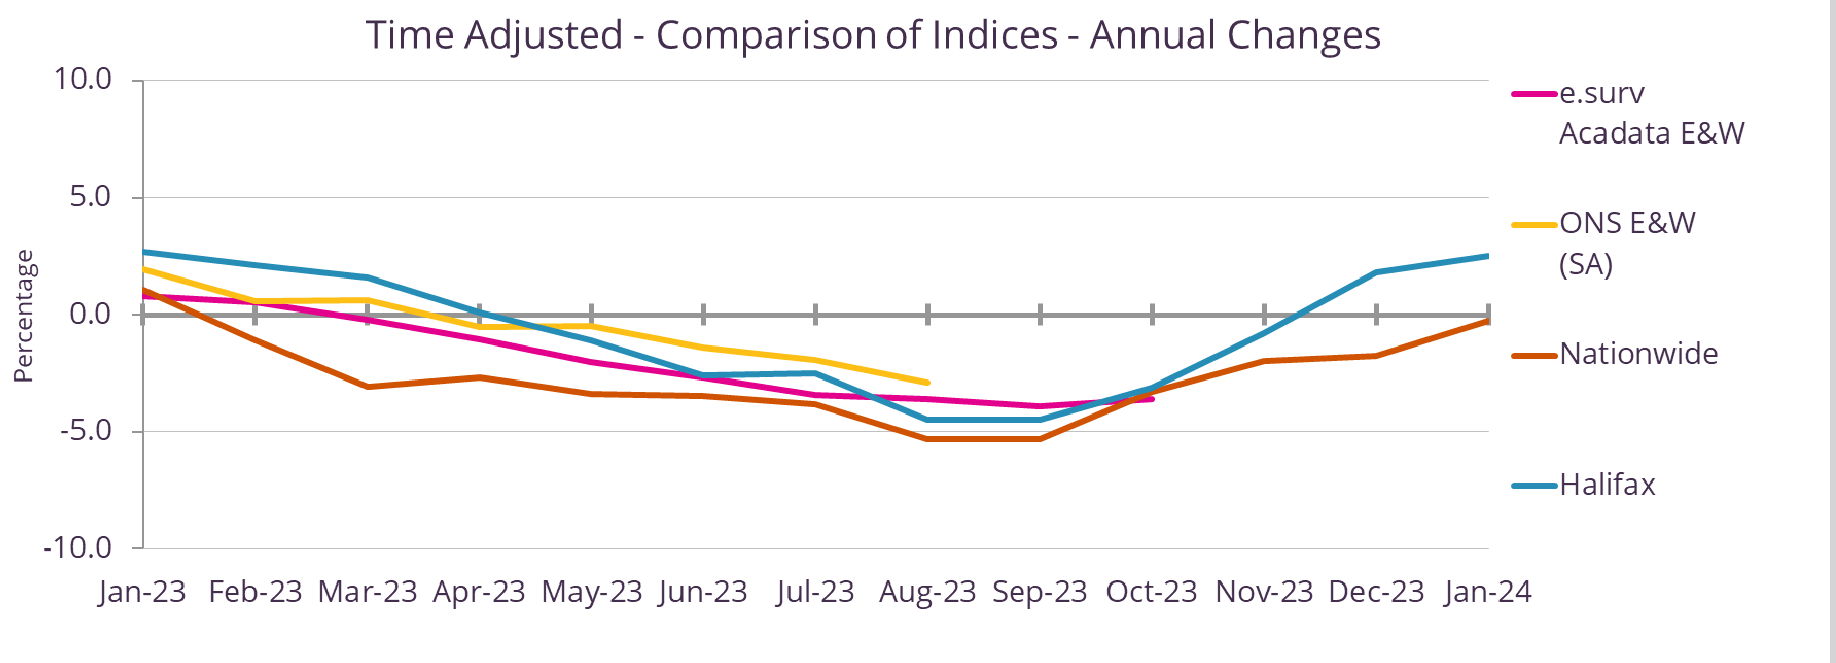
Figure 5. The annual change in house prices January 2023 – January 2024 (Time adjusted)
Figure 5 has been adjusted to allow for the known time lag that exists between the timing of the two lender indices and that of the two Land Registry based indices, which in the current market has been assumed to be three months. The Rightmove index has been removed from Figure 5, as it is based on market sentiment as opposed to the price actually paid for a property.
As can be seen in Figure 5, there is a high degree of similarity between the four published indices, except for the latest two months where a divergence between the two lender indices has emerged.
The maximum range between the indices still occurs in March 2023, but is reduced to 4.7% in Figure 5, compared to 6.1% in Figure 4. The minimum range still occurs in October 2023, but reduces to 0.5% in Figure 5, compared to 2.6% in Figure 4. Finally, the average range in 2023 in Figure 5 comes in at 2.1%, compared to 4.6% in Figure 4.
Housing transactions per month
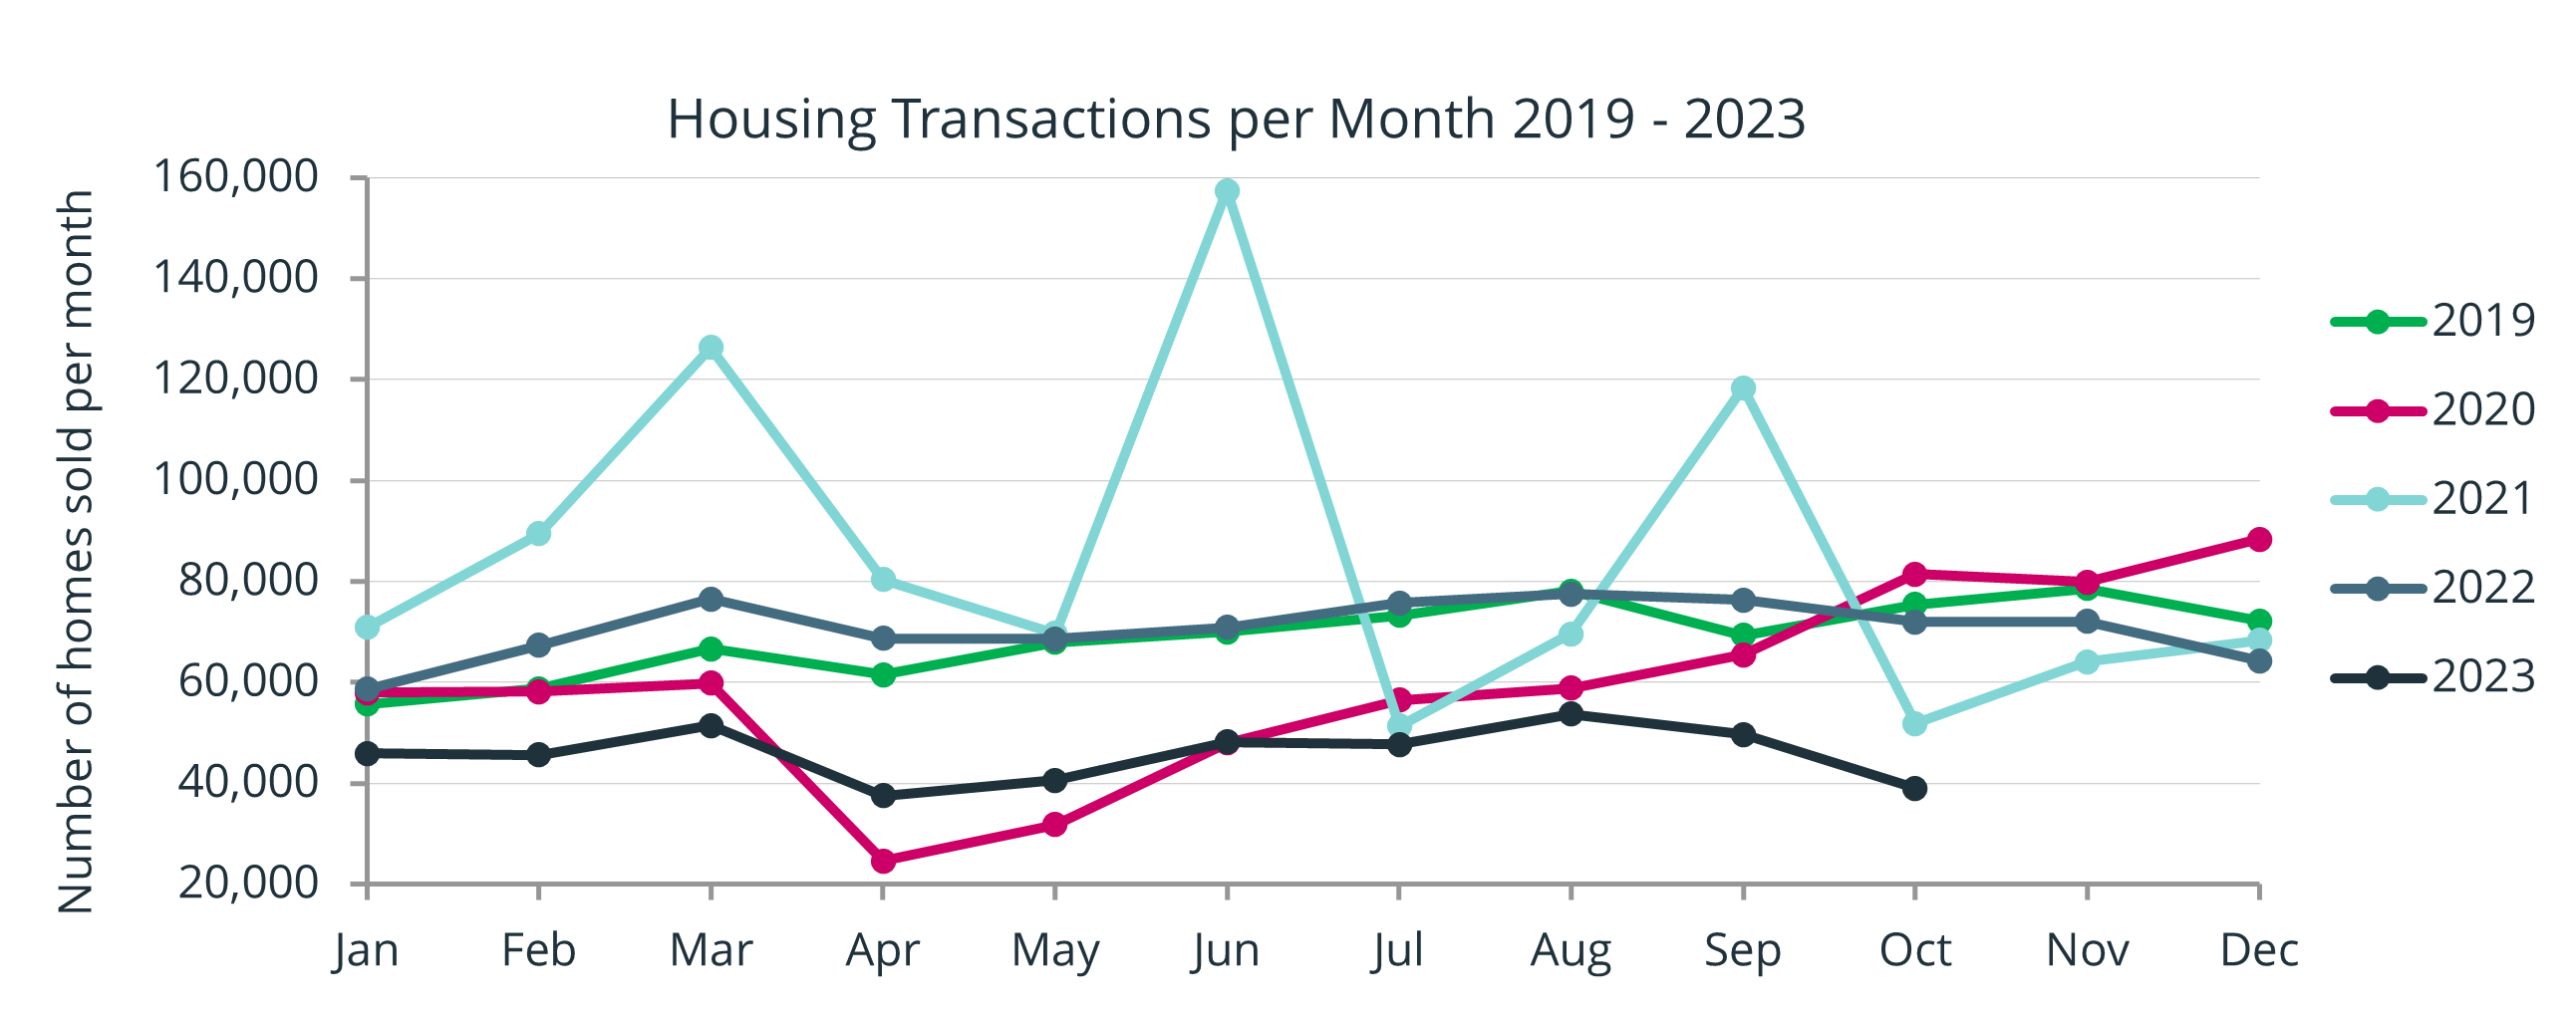
Figure 6. The total number of housing transactions per month, January 2019 – October 2023
Figure 6 shows the total number of domestic property transactions per month recorded at the Land Registry (HMLR) for England and Wales, covering the period from January 2019 to October 2023.
Looking at 2023 (the black line), the year started with the base interest rate at 3.5%, which at the time was the highest rate seen in the UK since November 2008. This relatively high rate had an adverse effect on property transactions, with only 45,884 sales for January 2023 being recorded by HMLR to date – the lowest January total since 2013, when strict lending criteria were limiting the number of mortgages made available.
The Bank Base rate then rose a further five times during 2023, and at the time of writing stands at 5.25%. This has reduced the number of transactions during 2023, with an average sales total of 45,900 sales per month to the end of October – the lowest level of transactions over these ten months of the last seventeen years.
About e.surv Chartered Surveyors
e.surv is the UK’s largest valuation provider, directly employing over 600 residential surveyors across the UK, supported by a network of consultant valuers.
The business is appointed as Panel Manager for more than 20 mortgage lenders and other entitieswith interests in residential property, and also provides a number of private survey products direct tothe home-buying public.
e.surv is part of LSL Property Services plc which includes household names Your Move, Reeds Rainsand PRIMIS.
For further information, please visit our website: www.esurv.co.uk


Comments